The wealth of information available to today’s energy professionals can seem overwhelming at times. With so much coming at you at once, where should you direct your attention? Each issue, energy.ink’s Data Dive features one informational report, study or survey worthy of closer inspection.
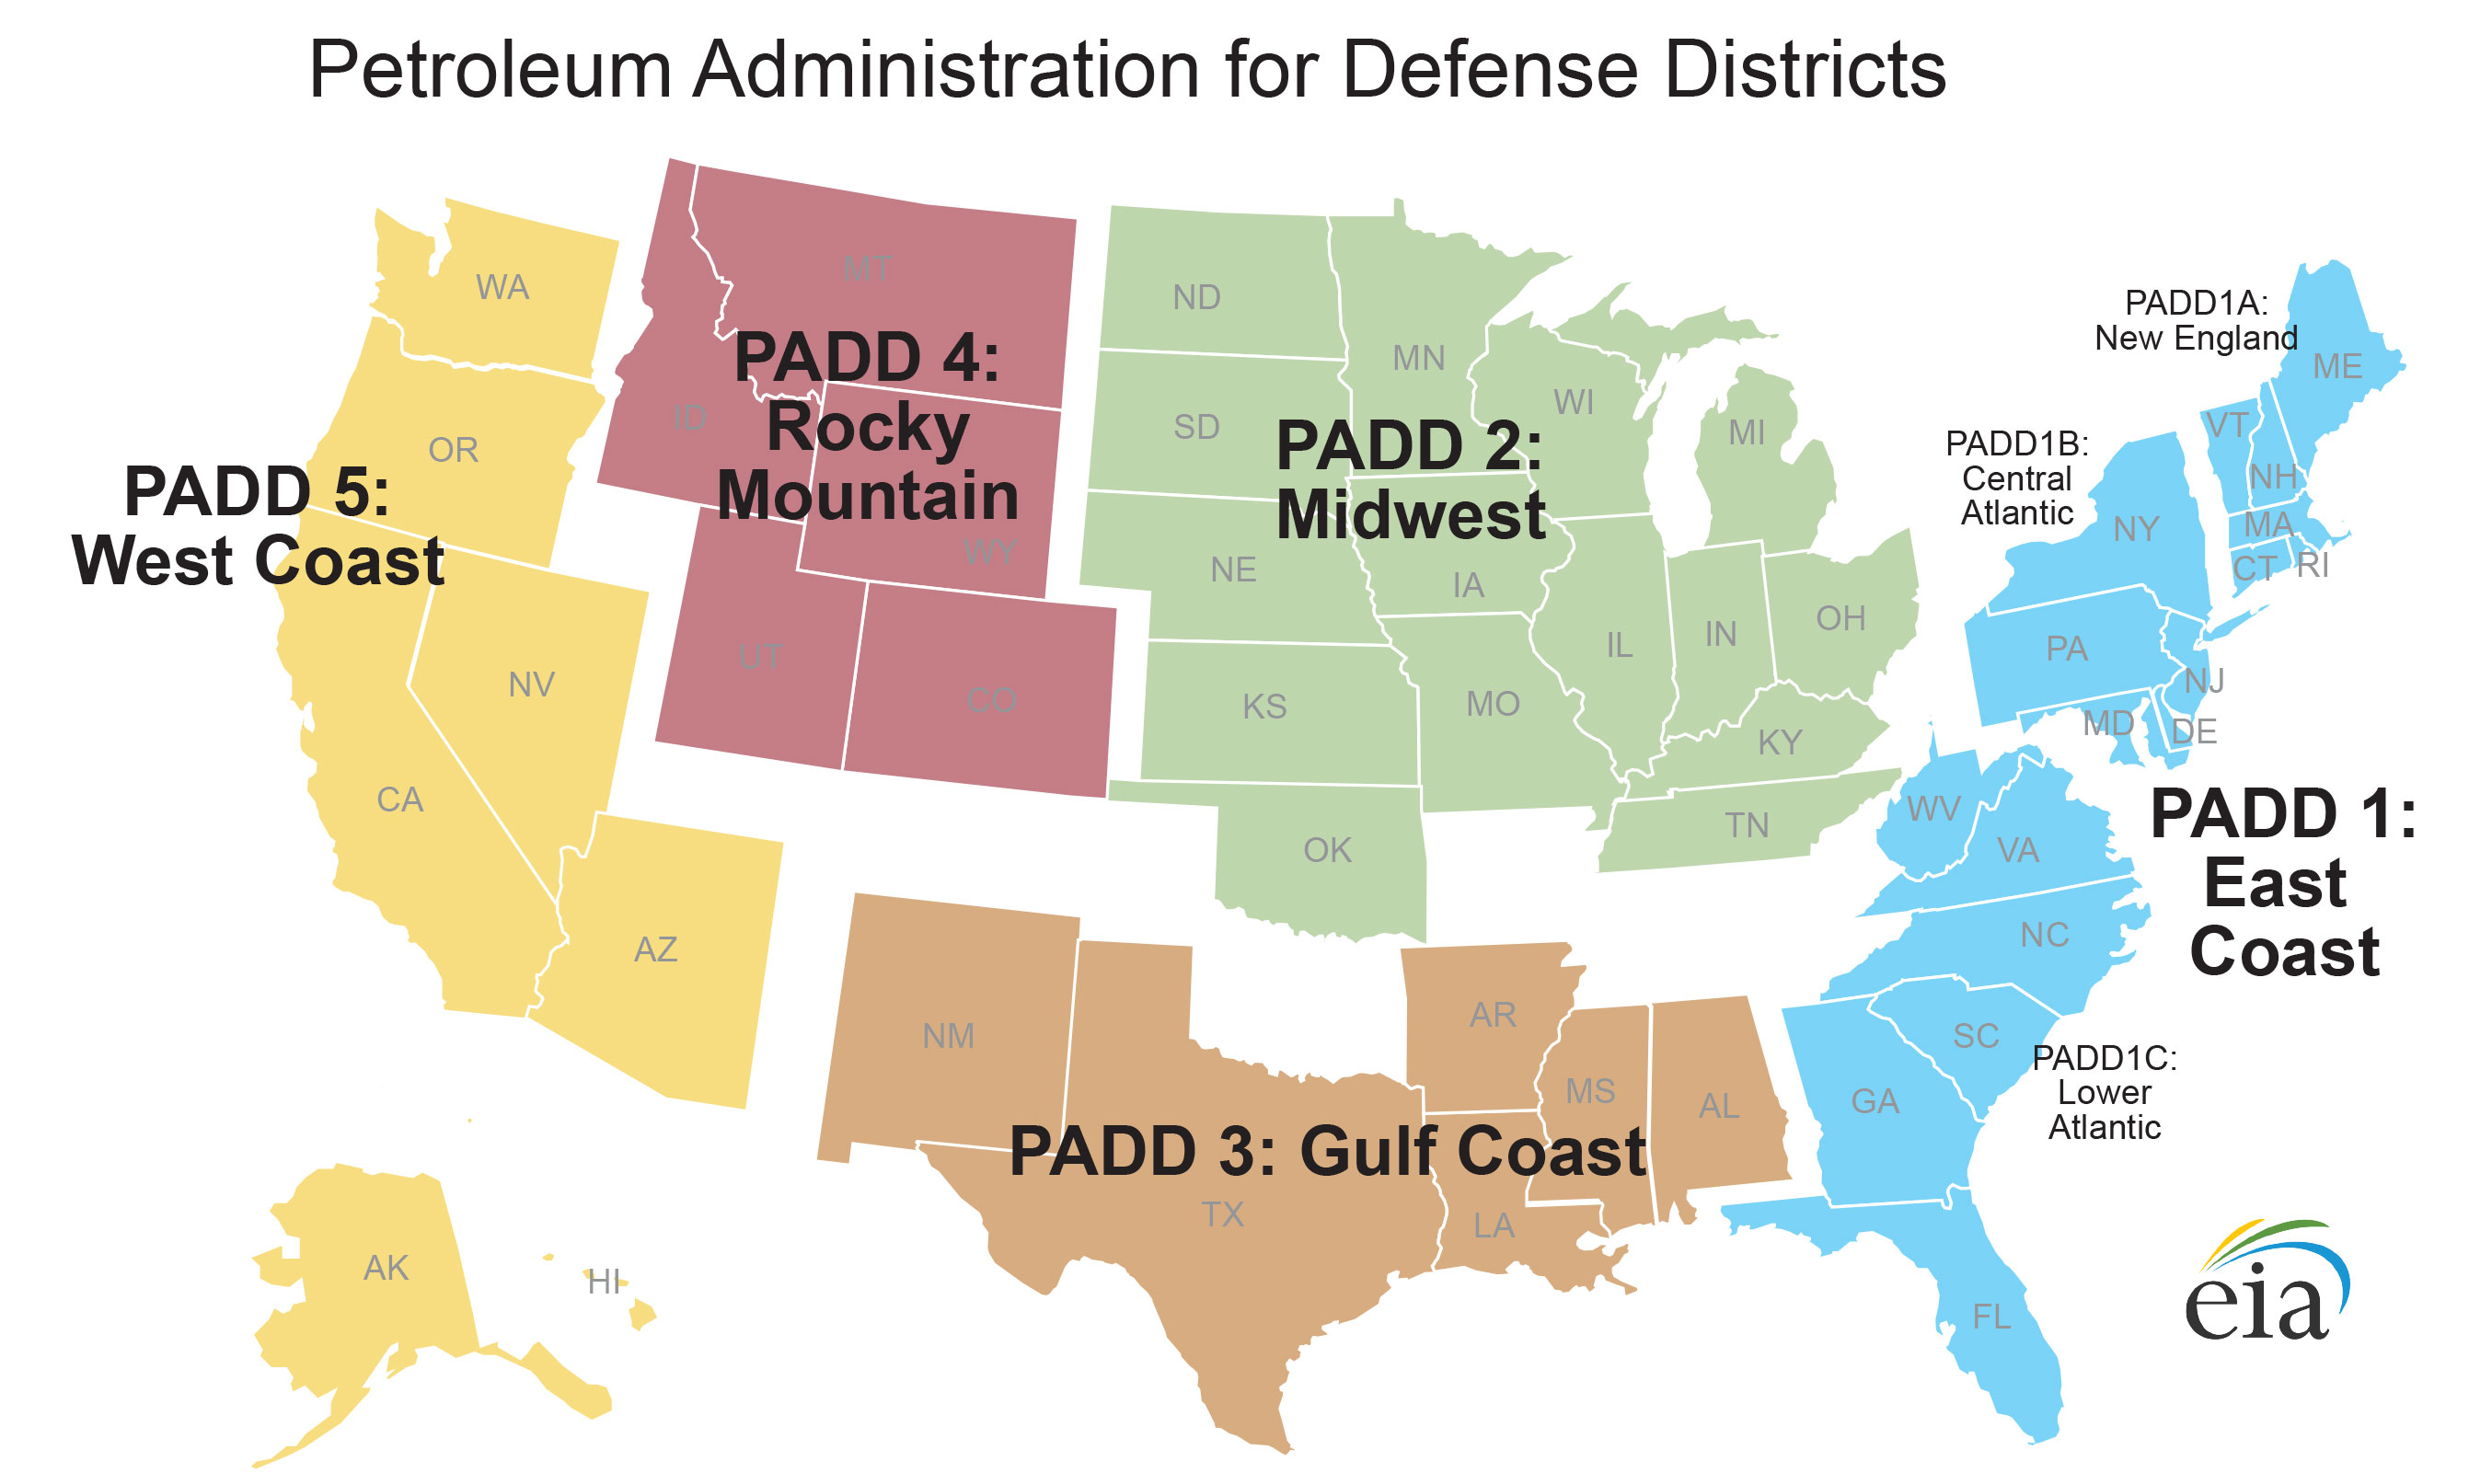
 On October 23, the U.S. Energy Information Administration (EIA) released its annual U.S. Biodiesel Production Capacity Report. Containing data for all U.S. biodiesel plants in operation as of January 1, 2020, the report parses U.S. production capacity by Petroleum Administration for Defense District (PADD). The report quantifies each region’s number of plants along with their annual and daily production capacity, as reported in the EIA-22M Monthly Biodiesel Production Survey.
EIA’s overview shows the following:
| U.S. Biodiesel Annual Production Capacity as of January 1, 2020 | |||||
| PAD District | Number of Plants |
2020 Production Capacity |
2019 Production Capacity |
||
| (MMgal/year) | (mb/d) | (MMgal/year) | (mb/d) | ||
| PADD 1 | 17 | 179 | 12 | 197 | 13 |
| PADD 2 | 42 | 1,500 | 98 | 1,474 | 96 |
| PADD 3 | 16 | 612 | 40 | 628 | 41 |
| PADD 4 | 1 | (s) | (s) | 40 | 3 |
| PADD 5 | 15 | 223 | 15 | 224 | 15 |
| U.S. Total | 91 | 2,514 | 164 | 2,563 | 168 |
A more detailed, plant-specific view is available here.
It could be argued that biodiesel production capacity decreased between 2019 and 2020 because of plant closures resulting from uncertainty over the status of the U.S. Renewable Fuel Standard and small refinery exemptions (SRE). In recent months, however, biodiesel producers have received some positive news on the SRE front, as the Environmental Protection Agency elected to deny 54 so-called gap-filling petitions.
How this will impact biodiesel production capacity in the months to come remains to be seen, but readers are encouraged to keep an eye on EIA’s Monthly Biodiesel Production Report for the latest data.
